lindsay vickery
  • lv
  • music
    • listen
    • Works by Instrumentation
    • Works by Concept
    • 2014 onwards >
      • music 2022
      • music 2021
      • music2020
      • music2019
      • music 2018
      • music 2017
      • music 2016
      • music 2015
      • music 2014
    • music 2009-2013 >
      • music 2013
      • music 2012
      • music 2011
      • music 2010
      • music 2009
    • music 1997-2008 >
      • music 2004-8
      • music 2003
      • music 2002
      • music 2001
      • music 2000
      • music 1998-9
      • music 1997
    • music 1985-1996 >
      • music 1995-6
      • music 1993-4
      • music 1991-92
      • music 1988-90
      • music 1985-87
  • writing
    • Research Projects >
      • screening the score >
        • scrolling notation
        • rhizomatic scores
      • expanded music notation
      • realtime notation
      • scoring field recordings
      • spectral analysis as a compositional tool
      • computer controlled performance environment
    • research >
      • research 2021
      • research 2020
      • research 2019
      • research 2018
      • research 2017
      • research 2016
      • research 2015
      • research 2014
      • research 2013
      • research 2011-12
      • research 2008-10
      • research 2001-04
    • teXts
    • presentations
  • performance
    • performance 2017- >
      • performance 2022
      • performance 2021
      • performance 2020
      • performance 2019
      • performance 2018
      • performance 2017
    • performance 2009-16 >
      • performance 2016
      • performance 2015
      • performance 2014
      • performance 2013
      • performance 2012
      • performance 2011
      • performance 2010
      • performance 2009
    • performance 1997-2008 >
      • performance 2005-8
      • performance 2004
      • performance 2003
      • performance 2002
      • performance 2001
      • performance 2000
      • performance 1999
      • performance 1998
      • performance 1997
    • performance 1985-1996 >
      • performance 1992-6
      • performance to 1991
    • solo performance
  • gallery
    • scoreplayerscores
    • environmental scores
    • nature forms
    • landscapes
    • graphic scores
    • schematics
    • spectrograms
    • oddities
  • POI
  • Blog
  • Blag

the problem of yellow...

29/4/2014

0 Comments

 
Picture
A notional colour spectrum based on human visual perception from white to black (based on CIELAB colour space (Hoffman 2003) and Bruce MacEvoy’s Artist’s Value Wheel (MacEvoy 2005).    
Human vision utilizes only three types of colour-sensitive cone cells - red, green and blue – and hues with frequencies between these (such as yellow, cyan and magenta) are perceived through stimulus to multiple cone cells. For example the frequency of yellow light falls between red and green and is detected by stimulus to both the red and green cone cells and as a result appears “lighter” than green even though its frequency is not as “high”. In this way, visual perception differs greatly from auditory perception. 
The illustration to the left  shows the a notional colour spectrum based on human visual perception. The notional colour spectrum provides a palette from which colours representing sonic features or instruments might be chosen in a musical score. For most people this chart appears segmented into families of similar hue (yellows, oranges, tan, green-blue etc) and distinct but related hues may lend themselves to the representation of timbral variation within a sonic feature or instrument. 
As the number of represented features increases, however, so does the difficulty of discriminating between hues required. Green-Armytage suggests a palette of 27 tones based on white, yellow, orange, lime, green, turquoise, blue and purple and their lighter or more saturated counterparts, as a template for colour representation in charts such as subway maps and data visualisation (Green-Armytage 2001). 
Grisolm and Palmer have explored the idea of using cross-modal associations to define semantically sound mapping a range of instrumental timbres against colours in a two dimensional red/green: yellow/blue field. The illustration to the right shows their distribution of instrument timbre to colour (a.) and  the suggested semantically appropriate colour and colour range for five instruments (b.). Grisolm and Palmer have also demonstrated that “color choices for multiple timbres are well predicted by an average combination of the component timbres” (2013). 
Interestingly Grisolm and Palmer also have observed, for example, that the yellow-blue value is correlated with
 attack time, whereas
 average red-green value is correlated with spectral brightness (2013).
Picture
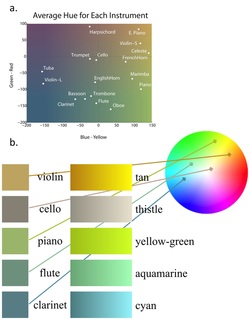
Colour-to-sound associations between instrument timbre and colour (from Grisom and Palmer 2013), b.) Implied “semantically sound” hues for five instruments.    
0 Comments


Leave a Reply.

    lindsay vickery

    test version

    Categories

    All

    Archives

    September 2020
    October 2019
    September 2018
    August 2018
    March 2018
    October 2017
    September 2017
    May 2016
    April 2016
    November 2015
    October 2015
    August 2015
    June 2015
    April 2015
    March 2015
    December 2014
    October 2014
    September 2014
    August 2014
    July 2014
    June 2014
    May 2014
    April 2014
    March 2014
    February 2014
    January 2014
    December 2013
    October 2013
    September 2013
    August 2013
    July 2013
    June 2013
    May 2013
    April 2013
    March 2013

    RSS Feed

Proudly powered by Weebly