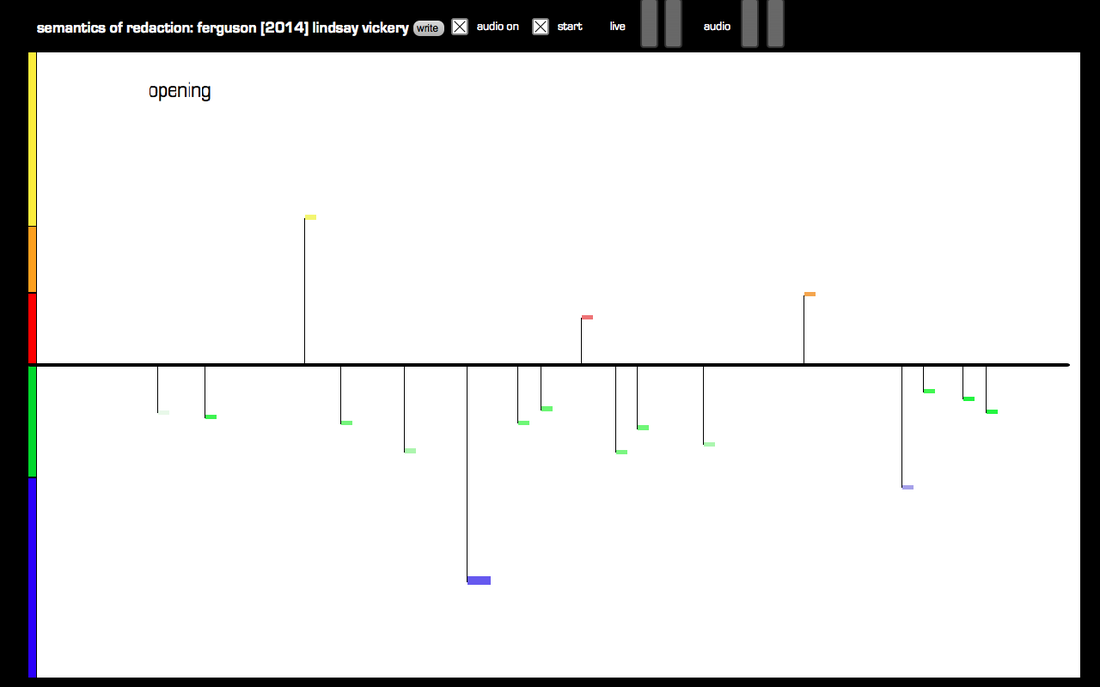
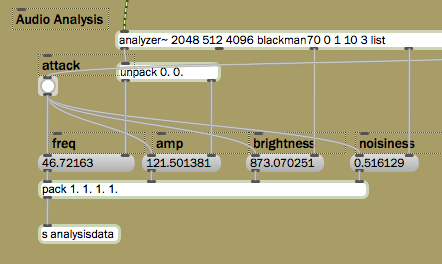
| The notation for SoR (Image left) is principally created by using accents detected in a speech recording in real-time to generate graphical symbols of varying vertical position, size and colour, determined by the frequency, amplitude and timbre of the recording at the accent point. Analysis of the recording is derived from Tristan Jehan’s analyzer~ object, using attack, frequency, amplitude, brightness and noisiness data. The flow of analysis data is captured at the point of each detected attack (See Figure 2). By default the values defining an attack are an increase in the incoming signal of +10db in a period less than 100ms, however the performer may alter these values to achieve a better score/visualisation result. | The opening section of The Semantics of Redaction [2014]. |
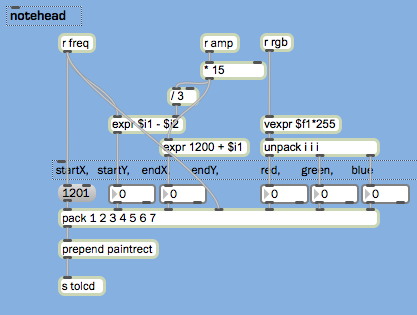
| The flow of analysis data is captured at the point of each detected attack. | The data is mapped in the following manner: Frequency: Vertical height and notehead colour hue
|
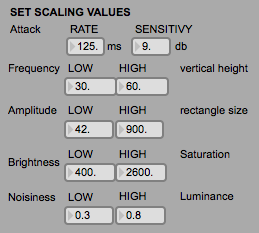
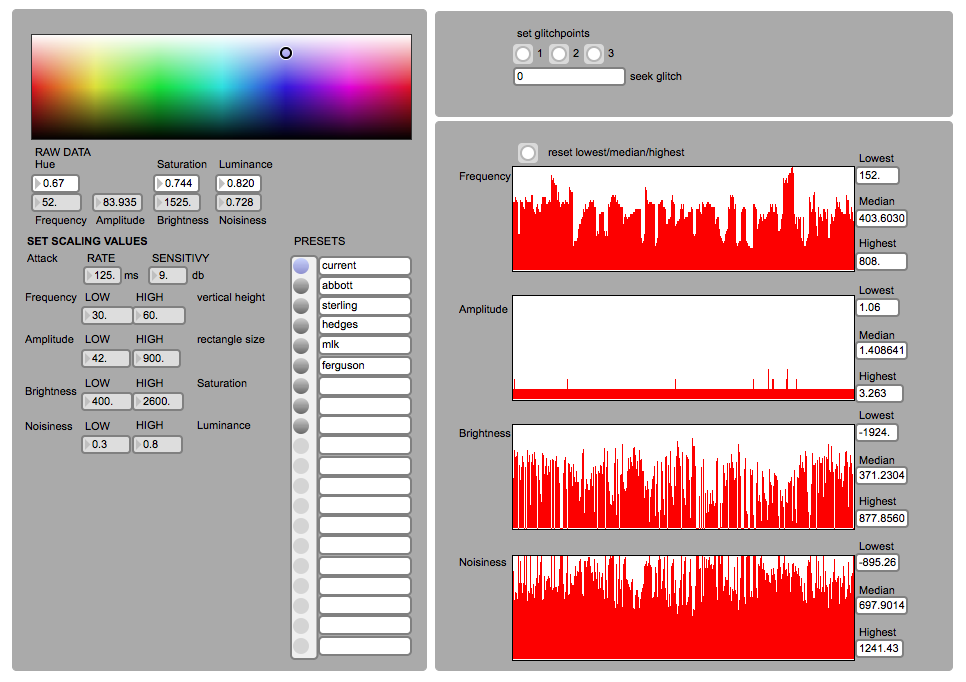
| Because of the variation of the acoustic characteristics of potential recordings and performer preferences, an analysis window allows the performer to scale incoming data. Scaling changes may be necessary because of variations in the average frequency of the speaking voice or ambient noise in the recording. From the performer’s perspective the attack rate and sensitivity values create changes in the density number of note events in the score. The analysis window provides the performer with “peak”, “trough” and “mean” values for each of the analysis parameters from the recording, as well as a graphical display showing the most recent 100 values for each parameter. A swatch graphically displays the variations in notehead colours. A preset object allows the performer to save the chosen scalings for each new recording. | Data is drawn to MaxMSP’s jit.lcd object using the standard paintrect command. |
| Analysis window (detail) performer-variable scaling values. | Although it would be possible to automate the scaling process, allowing the performer to set the values provides a means to individualise the score that is generated. For example to achieve variations in the number of noteheads that fall in different “registers”. Unlike Lyrebird, which has a range of colour interpolations and generates a spectrogram-like score, only five hues (Yellow, Orange, Red, Green and Blue) are used in SoR (although there is continuous variation in the saturation and luminance of each colour). This approach was taken to achieve a clear differentiation between five registers in the score which are conceived as instrument groups by the percussionist: for example ranging from yellow (high-pitched instruments) to blue (low-pitched instruments). The notehead size is intended to correlate to the performer’s dynamic range. |

 RSS Feed
