Ablinger: Phonorealism
Spectral analysis data from recordings is “reconstituted in various media: instrumental ensembles, white noise, or computer-controlled player piano.
The Speaking Piano
"The reproduction of "phonographs" by instruments can be compared to photo-realist painting, or - what describes the technical aspect of the "Quadraturen" more precisely -with techniques in the graphic arts that use grids to transform photos into prints Using a smaller grain, e.g. 16 units per second, the original source approaches the border of recognition within the reproduction." Ablinger, P., (2011). Quadraturen 1995-2000.
The thing that is interesting about sonification/visualisation/re-sonfication/re-visualisation (etc) is not only the distortion it creates, but also how, like the sponge that can be passed through a sieve but will reconstitute itself, the transfer from one modality to another (and back) retains elements of form.
In Nature Forms I, the visual representation of natural shapes is passed through the distorting mirrors of three performers and a computer. Four contrasting forms of reading/sonifcation are presented for the audience: machine sonification in which spatial position and colour are more or less precisely rendered; tablature in which spatial position and colour are recast against the geography of a specific instrument; semantic reading in which the performer’s understanding of notational conventions informs the outcome; and aesthetic reading in which the performer’s understanding of the conventions of sonic representation of broader conceptual issues are drawn upon.
In Nature Forms I, the visual representation of natural shapes is passed through the distorting mirrors of three performers and a computer. Four contrasting forms of reading/sonifcation are presented for the audience: machine sonification in which spatial position and colour are more or less precisely rendered; tablature in which spatial position and colour are recast against the geography of a specific instrument; semantic reading in which the performer’s understanding of notational conventions informs the outcome; and aesthetic reading in which the performer’s understanding of the conventions of sonic representation of broader conceptual issues are drawn upon.
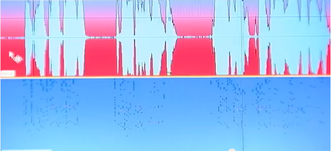
| Software written in MaxMSP sonifies the score each vertical pixel of a grayscale version of the spectrogram to 613 independent sinewaves at a horizontal rate of 25 pixels per second (See Figure 3). In the patch a .png file of the sonogram is loaded into a jit.qt.movie, it is then played through jit.matrix and jit.submatrix that send an image of one pixel width to the jit.pwindow. Data from the submatrix is split into a list of 613 values in jit.spill and these values are represented in a mutlislider. The vertical pixels are scaled logarithmically between 8 and 6645hz (the highest represented frequency in the sonogram and just beyond the highest pitch attainable by the ensemble) and mapped to an individual cycle~ object. The grayscale value of each pixel is scales and mapped to the amplitude of each cycle~ object. A comparison between sonograms of the soundfile of the original source recording and the re-sonified version indicate (See detail left). (see the while sonfication at http://www.youtube.com/watch?v=gLew15g7B9A). | 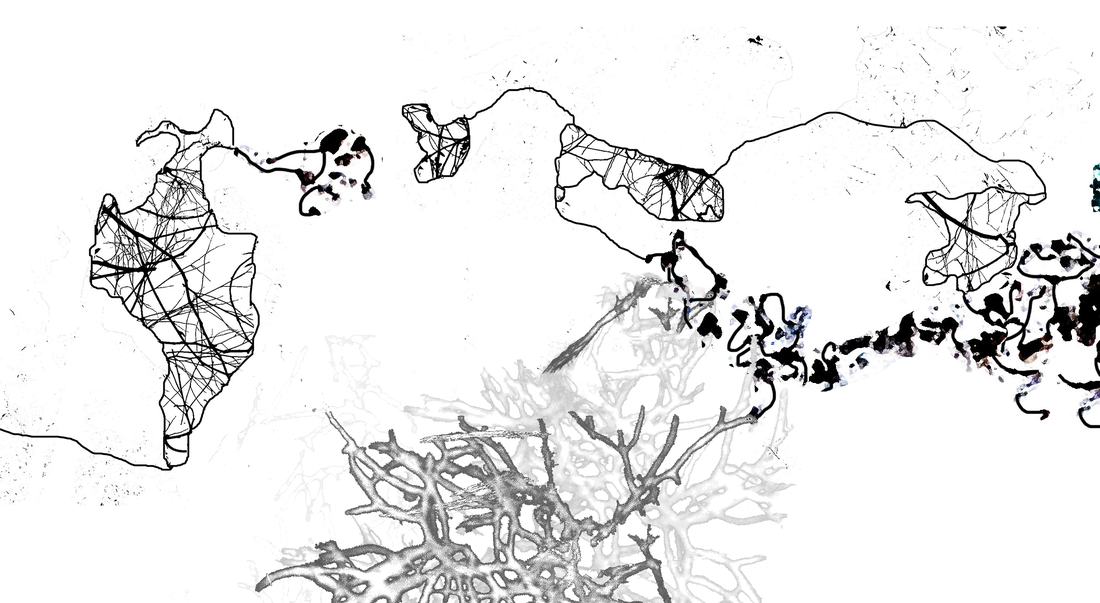 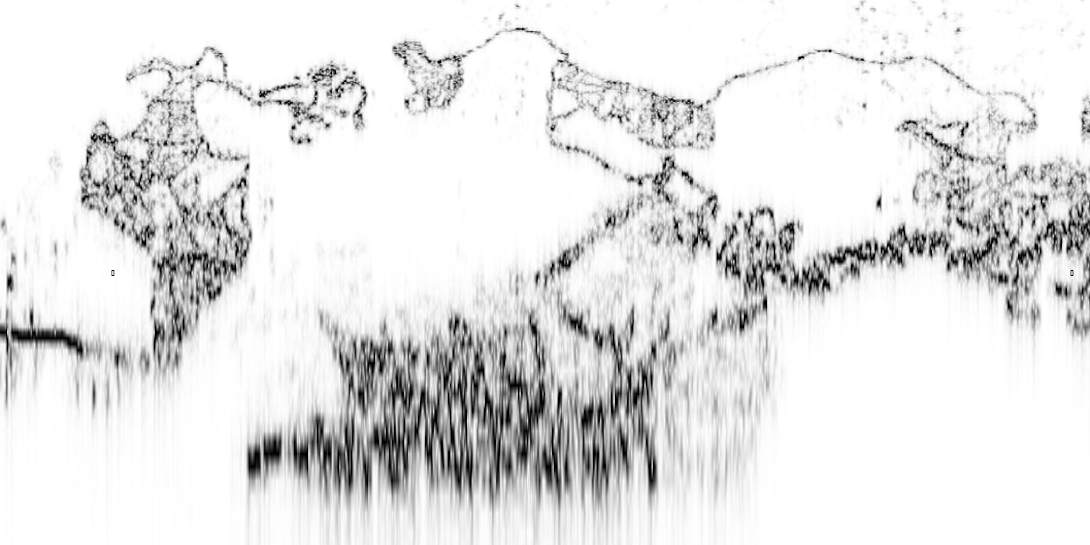 |
 RSS Feed
